Grafana Monitoring Art datasource

![]() Please add your GitHub star ★, it will encourage us to publish more Monitoring Art dashboards.
Please add your GitHub star ★, it will encourage us to publish more Monitoring Art dashboards.
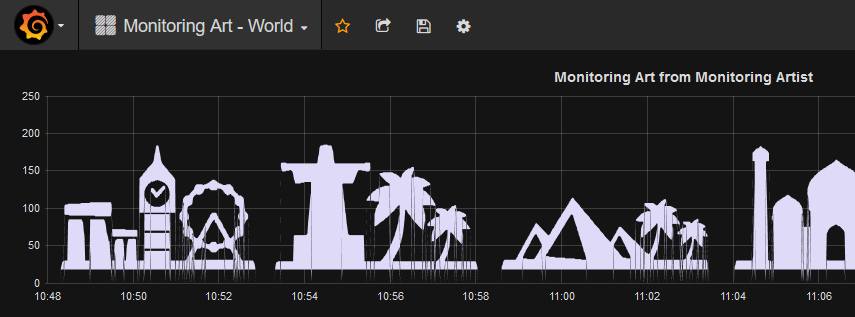
Add some art into your Grafana. Real metrics. No dependency, no waiting for data
collection. Just install, import dashboard(s) and enjoy it immediately. Visit
plugin presentation microsite www.monitoringart.com.
![]()
![]()
![]()
Use the grafana-cli tool to install Monitoring Art from the commandline:
grafana-cli plugins install grafana-monitoring-art
The plugin will be installed into your grafana plugins directory; the default is/var/lib/grafana/plugins.
Note: Grafana 3.0 or greater is required to install and use plugins.
No configuration. Just add the datasource and then import dashboard(s).

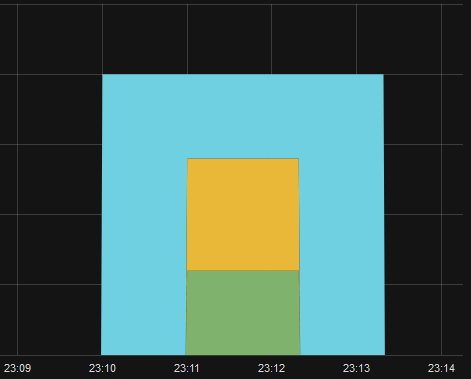
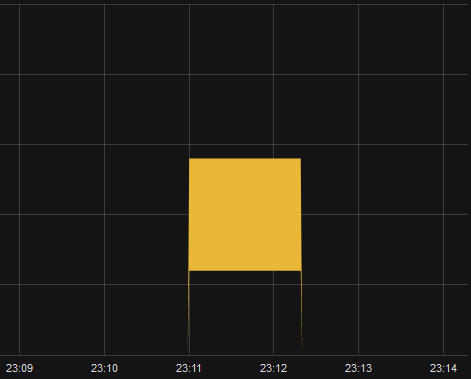
Get right metric values. Build stacked graph, tweak colors and metric order/lines
filling. For example how to visualize the square:


Do you want Monitoring Art with your logo? Not a problem. Contact author and buy
your customized Monitoring Art.
Feel free to create pull request to improve datasource/datasets quality.
Devops Monitoring Expert,
who loves monitoring systems and cutting/bleeding edge technologies: Docker,
Kubernetes, ECS, AWS, Google GCP, Terraform, Lambda, Zabbix, Grafana, Elasticsearch,
Kibana, Prometheus, Sysdig, …
Summary:
Professional devops / monitoring / consulting services:
![]()