Git metrics: cumulative line edits per author
A tool for counting cumulative changes per author for Git repositories.
Can output text, CSV, or LaTeX.
This program sums the output from git show --numstat to get actual number of
inserted/removed lines, unlike other line counting tools which use --stat to
estimate line counts (good luck with that, lol).
python3 countlines.py <path-to-repo> --by=name --output=tex > stats.texxelatex stats.texNote: <path-to-repo> can be a directory on the filesystem with a checked-out repository,
or it can be a git repository url. In the latter case, the code will be cloned to the local repo
directory (unless the directory already exists).
An alias file can be used to map email addresses to names. This is handy when
one or more authors have been inconsistent in their use of the author field in
their commits.
countlines.py <path-to-repo> --output=alias > aliasfilealiasfilecountlines.py <path-to-repo> --alias=aliasfile --by=name --output=csv > stats.csvThe columns included in the output can be customized, for example:countlines.py --columns=author,edits,first_date,last_date <repo>
The full list of available columns is shown in the help output.
The author column is controlled by the --by option.
Output can be written as a TeX file to produce pretty tables for articles etc.
Here is an example of the TeX output:
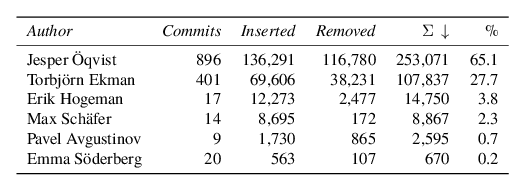
This table was generated with the following commands:
./countlines.py https://bitbucket.org/extendj/extendj --alias=aliases --by=name --output=tex --limit=6 > example.texxelatex example.texconvert -background White -layers flatten -density 120 -antialias example.pdf example-table.png
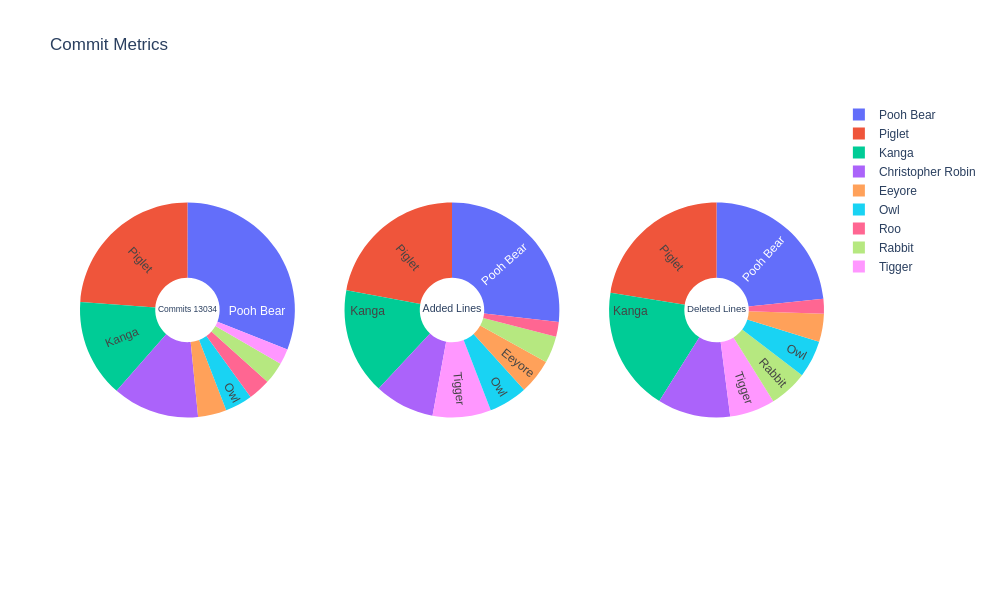
If output is written in CSV format, the plot.py script can be used to render pie charts with plotly:
./countlines.py --by name --alias authors.txt --output csv --branch master <REPO> > data.csvpython3 plot.py data.csv