Python package that helps you visualize football data :soccer:
Socplot is a python 3 package that helps you visualize football data. [WIP]
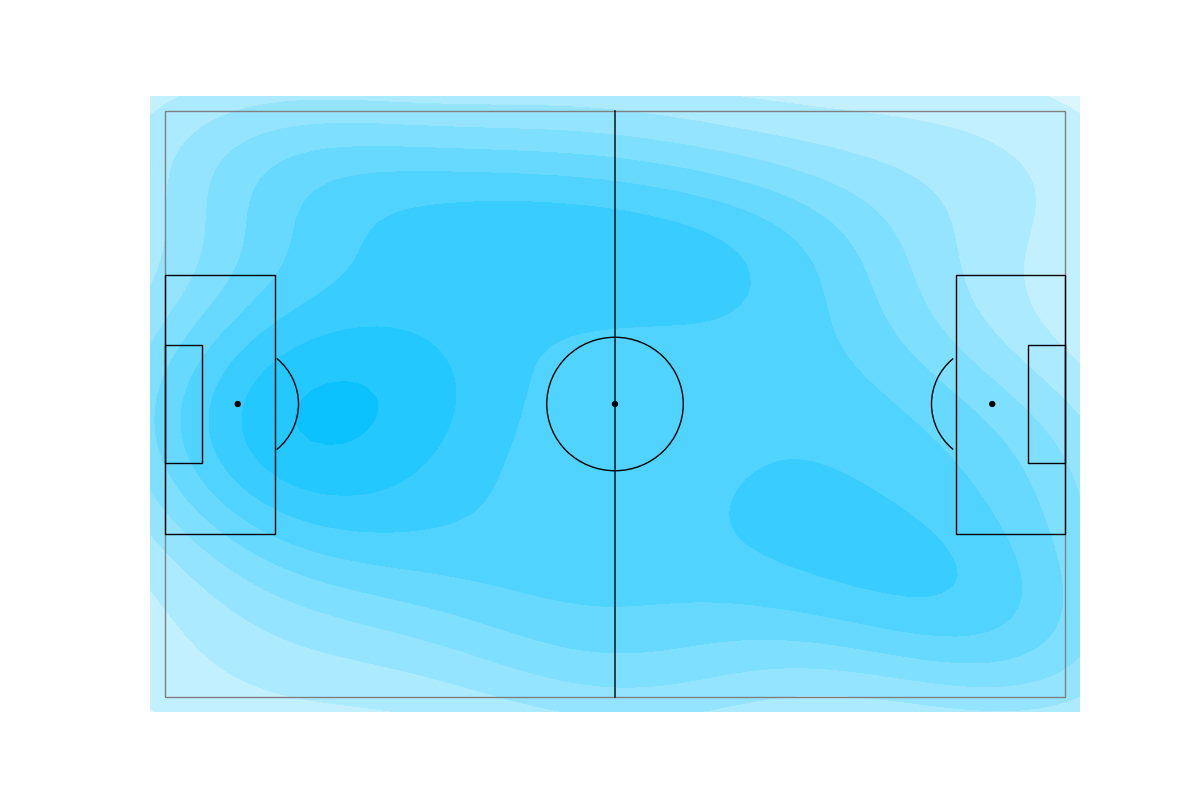
Pressure heat map
pressures position heat map for an example match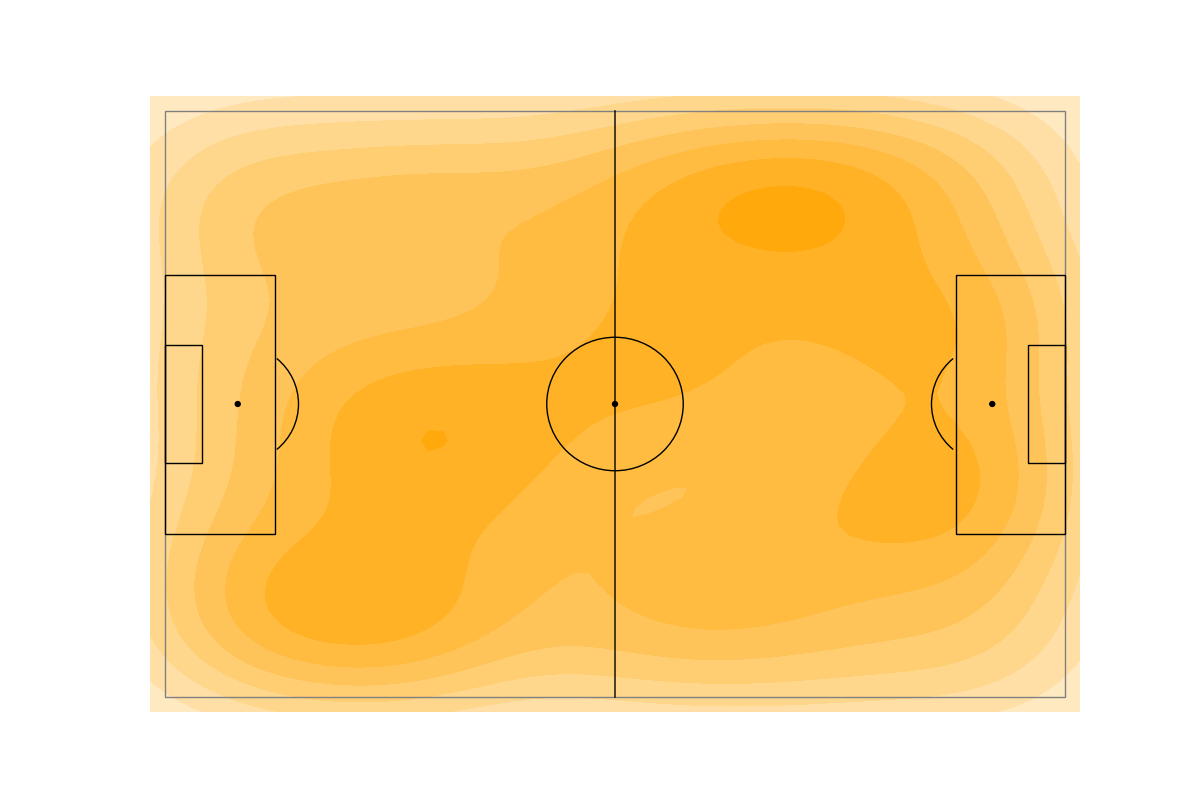
Pass map
pass map for selected time window in an example match
first 15 mins passes in an example match
code snippet used to generate the last imageimport pandas as pdfrom socplot.pitch import Pitchpitch = Pitch()# load the passes datasetfor _, row in passes.iterrows():pitch.plot_pass(row['sx'], row['sy']],[row['ex'], row['ey']] , row['type'])pitch.heat_map(df['sx'], df['sx'], color='tan')
__
pip installtion coming soon
# fork the repocd socplotvirtualenv -p python3 envsource env/bin/activatepip install -r requirements.txt
ArqamFc/Socplot licensed under the Apache License 2.0.